
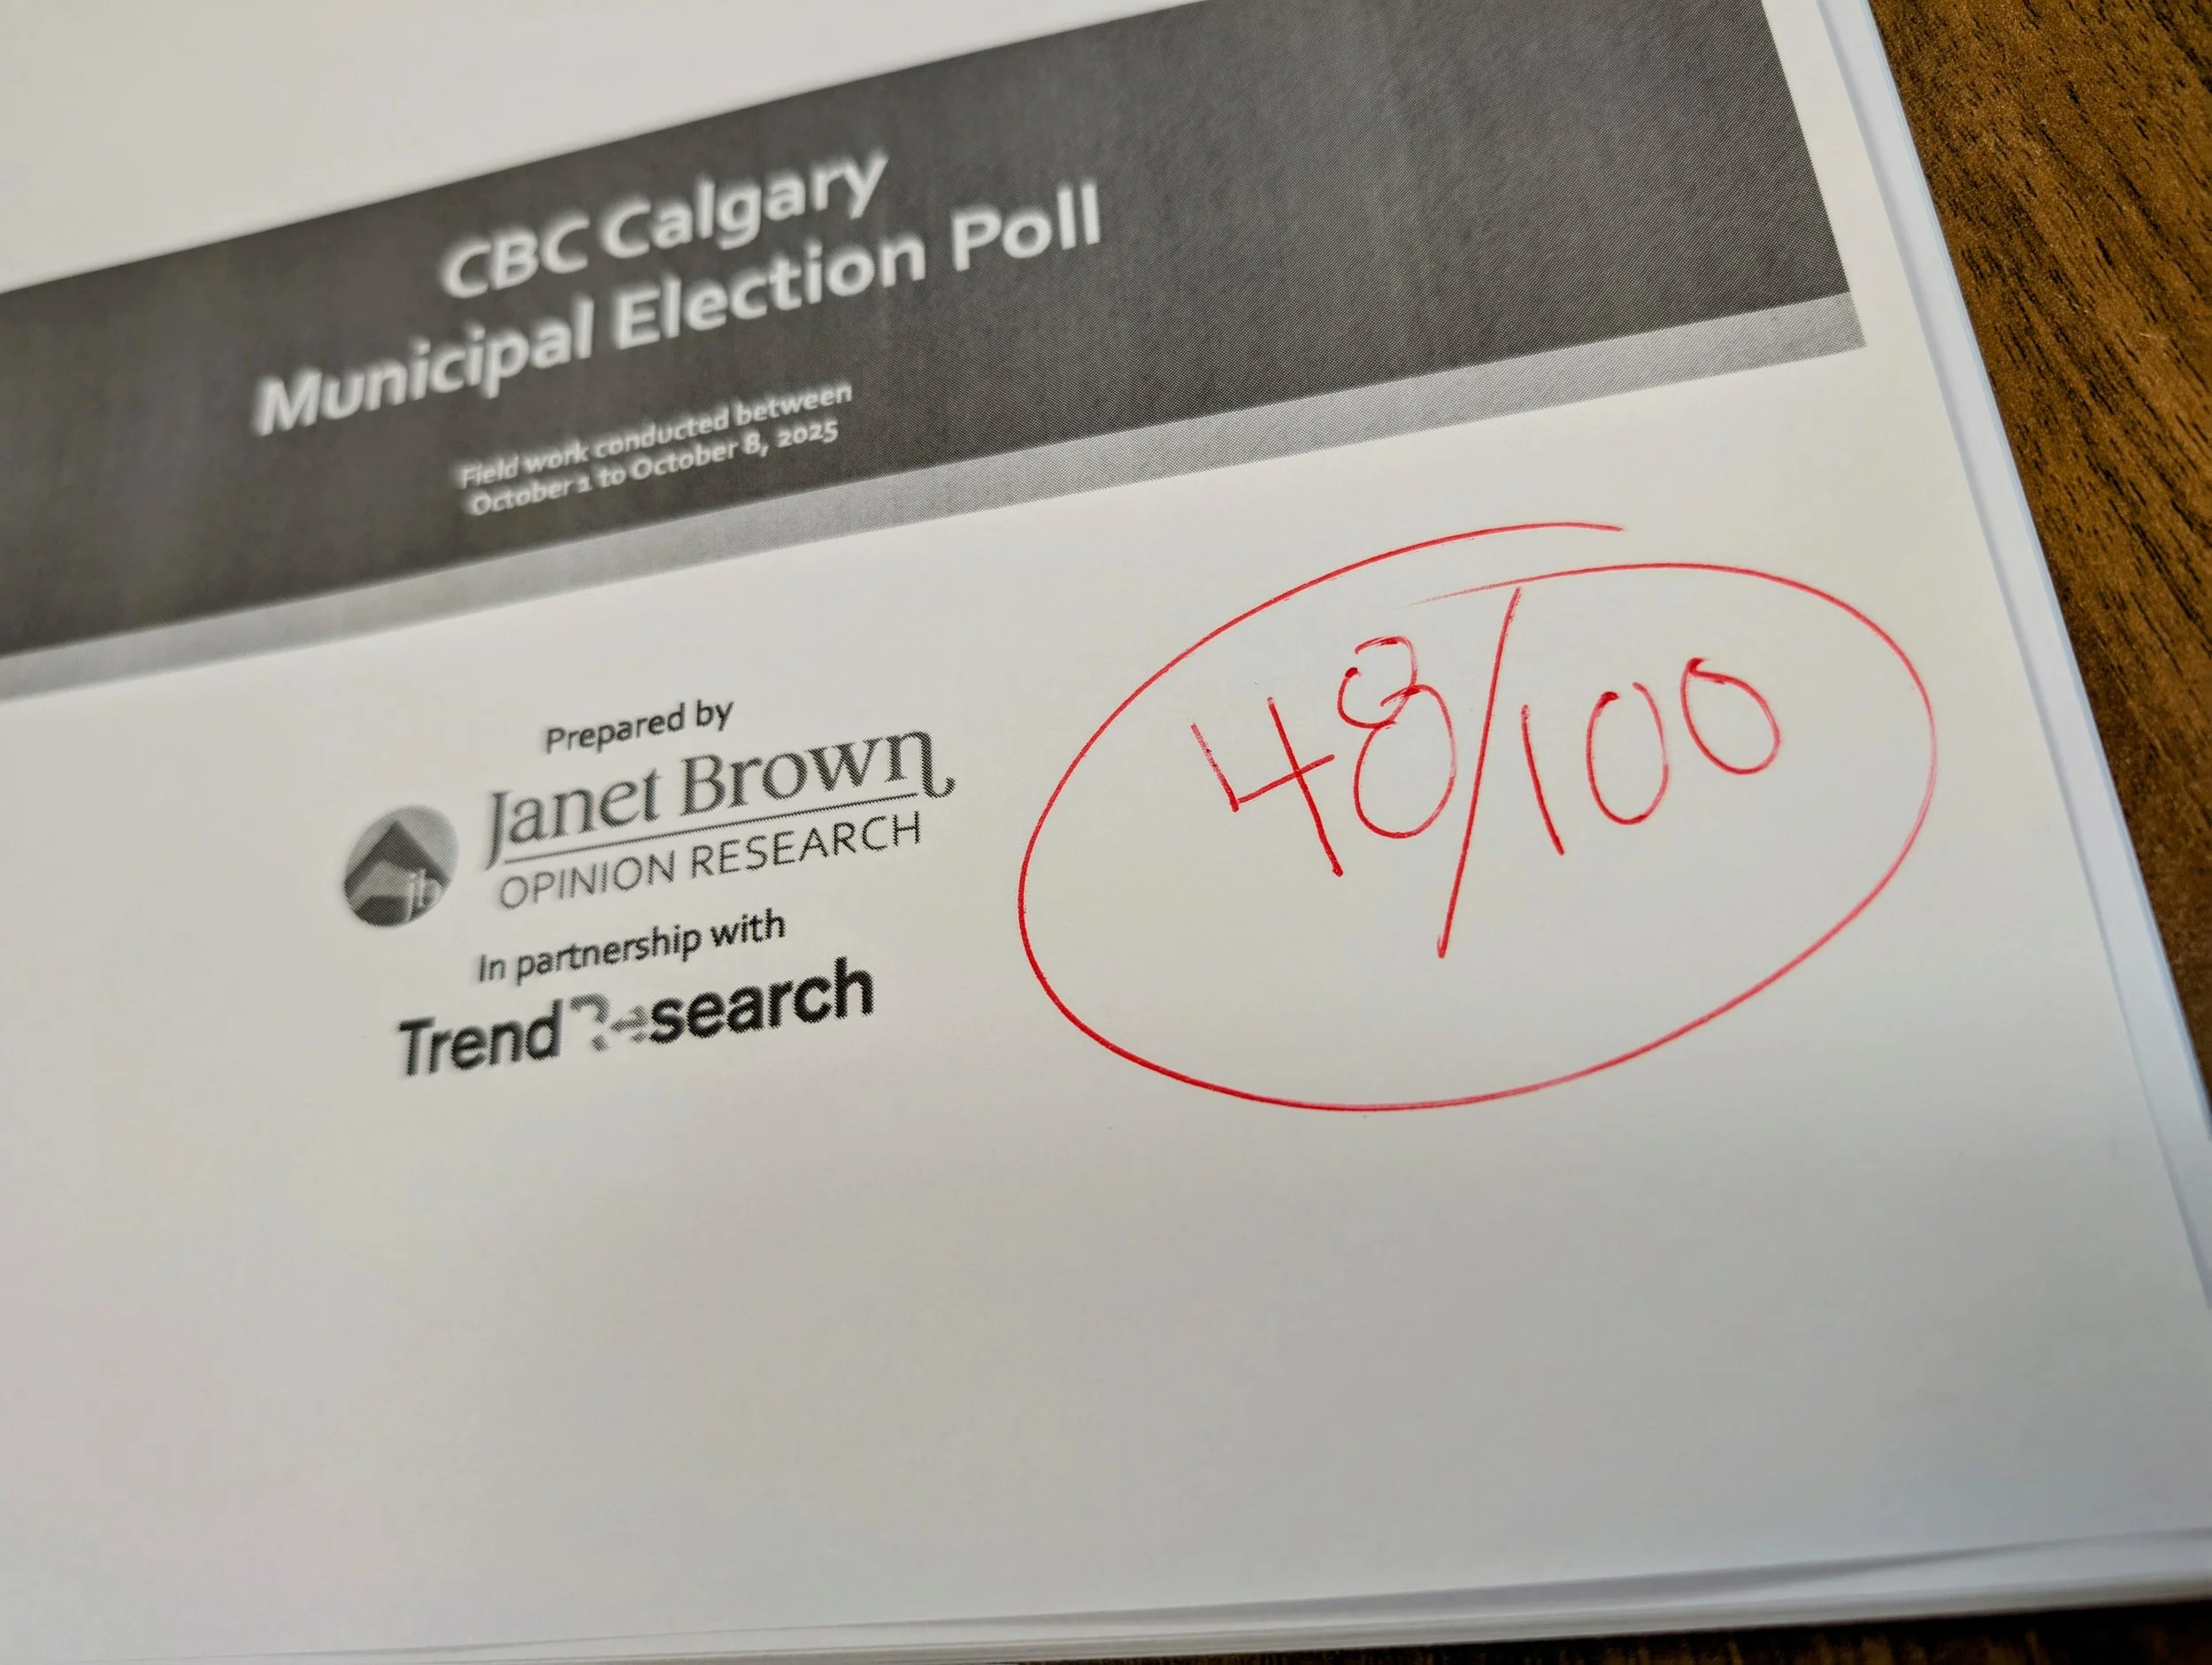
Janet Brown and Trend Search DOES NOT MEET EXPECTATIONS for Calgary CBC

48/100
Janet Brown and Trend Search published a public serviceable media crosstab pack with solid basic transparency for CBC Calgary—but it falls short of the highest professional bar because it leans on a non‑probability sample with minimal corrective weighting, uses classical significance flags that imply more inference power than the design supports, and presents cut‑pointed NETs without sensitivity checks. That’s why I land at 48/100.
Janet Brown Public Photo Source: LinkedIn
Other News: Larry Heather: a Threat to Democracy?
“A woman’s womb is the most dangerous place to live in Canada.”
– Heather, Larry
Continue Reading Janet Brown and Trend Search DOES NOT MEET EXPECTATIONS for Calgary CBCMethodological faults that erode trust
What Janet Brown and company actually measured is a mix of municipal service priorities, a horse‑race, one attitude about introducing parties into municipal politics, and a left–right self‑placement. There is no direct measure of democratic commitment (e.g., importance of living in a democracy, support for minority rights, tolerance for opposition, acceptance of electoral outcomes). The closest items—opinions on municipal parties (Q6–Q7) and a 0–10 left–right scale (Q10)—are not proxies for democratic values; they are about electoral mechanics and ideology. See the Methodology and overview slides (PDF p.1–3) and the sections presenting Q6–Q7 and Q10 (PDF p.103–115).
Methodological faults that erode trust
Non‑probability sample + inferential dressing
You state clearly this is an online panel with quotas for age, gender, and quadrant, and that “as a non‑probability online survey, a margin of error does not apply”. Then you add the “what a comparable probability sample would be” ±3.1pp line. This invites readers to read the tables as if they were probability estimates, which they aren’t (and the disclaimer says so). (Methodology, PDF p.2.) 2025-10-10 CBC Calgary Muni Pol…
Despite the non‑probability design, nearly every table announces “Significance Testing Applied: 95% (A–Z)” (e.g., Q4–Q5 pages). That letter‑tagged significance convention is appropriate for true random samples; here it manufactures false precision. (e.g., Q4/Q5 banners, PDF p.101–103; also earlier batteries.) 2025-10-10 CBC Calgary Muni Pol…
Trust impact: High. Presenting significance tests on a panel, after saying MoE doesn’t apply, is internally inconsistent.
Severe education skew with no quota/weighting fix
Your Weighted Total lines reveal a lopsided sample on education: High school or less = 67 out of 1000 (6.7%), University degree = 370 (37%), Post‑grad = 193 (19%). That’s 56% degree‑holders versus ~7% HS‑or‑less in the achieved sample. (See Q1a weighted totals, PDF p.7–8 of the PDF; also repeated across banners.) 2025-10-10 CBC Calgary Muni Pol…
Because your quotas were only age/gender/quadrant and you say “minimal weighting” to StatsCan, education was likely under‑controlled, leaving a sample that is far more educated than the population. (Methodology, PDF p.2.) 2025-10-10 CBC Calgary Muni Pol…
Trust impact: High. Education correlates with civic attitudes and institutional trust; this bias can tilt every “value of democracy” inference.
You surveyed “residents,” then analyze voters
The frame is “1,000 residents of the City of Calgary”, not eligible voters. The horse‑race tables still include a “Not eligible to vote” row (2%)—so the sample explicitly includes ineligible respondents. (Methodology, PDF p.2; vote‑intention banner, PDF p.107–110.) 2025-10-10 CBC Calgary Muni Pol… 2025-10-10 CBC Calgary Muni Pol…
“Decided and leaning voters” analysis (n≈657) further narrows to a motivated subset. (Decided/leaning banner intro, PDF p.50–51.) 2025-10-10 CBC Calgary Muni Pol…
Trust impact: Medium–High. Mixing residents with an election‑poll narrative muddles inference and can inflate candidate figures among the engaged.
Order and priming effects baked into the instrument
The very first battery (Q1a onward) asks “how important” various service goals are (taxes, transit, snow clearing, roads, housing, crime, etc.). Beginning with “Keep residential property taxes low” (Q1a) and “Keep commercial and business property taxes low” (Q1b) plausibly primes a tax frame for everything that follows. (PDF p.7–10.) 2025-10-10 CBC Calgary Muni Pol… 2025-10-10 CBC Calgary Muni Pol…
Trust impact: Medium. Early framing can saturate later answers—including the “best days are behind” affective item.
Top‑box inflation from a 0–10 “importance” battery
You collapse to 7–10 NET “important”, report means on an ordinal scale, and repeat it across 15+ items. This design structurally pushes to the top end, producing lots of “very important” findings by design (e.g., “improve public safety” mean 8.16; “maintain roads” mean 8.01). (PDF p.33–34 and p.21–22.) 2025-10-10 CBC Calgary Muni Pol… 2025-10-10 CBC Calgary Muni Pol…
Trust impact: Medium. Without trade‑offs or forced ranking, “importance” batteries mostly measure normative compliance (“everything sounds important”).
Weak measurement for democratic norms
The only democracy‑adjacent items are Q6 (“Has the introduction of municipal parties been positive/negative/ no difference?”) and Q7 (“More/less likely to vote for a party candidate / no difference”). Results are fragmented (Negative 45%, Positive 13%, DK 17%) and ambiguous—they capture brand mechanics, not democratic values. (PDF p.103–105.) 2025-10-10 CBC Calgary Muni Pol… 2025-10-10 CBC Calgary Muni Pol…
Trust impact: High for your core question. These items cannot support conclusions about the value of democracy.
Agree/Disagree item with negativity cue
Q5 (“Calgary’s best days are behind it”) is an agree/disagree statement—prone to acquiescence bias and negativity priming—and is then cross‑tabbed to the hilt. (PDF p.101–103.) 2025-10-10 CBC Calgary Muni Pol…
Trust impact: Medium. The wording can over‑detect pessimism; a balanced forced choice (ahead vs behind) would be cleaner.
Visually suggestive but conceptually slippery Venn chart
Your “Candidates Calgarians are Considering” graphic is based only on those who are considering at least one candidate (n=697) and the links show % who consider either of two names—not necessarily both—yet the layout invites a “shared support” interpretation. (PDF p.3–5.) 2025-10-10 CBC Calgary Muni Pol… 2025-10-10 CBC Calgary Muni Pol…
Trust impact: Medium. Easy to over‑read “overlap” that may just be either/or mention.
Multiple comparisons without control
Dozens of subgroup columns × dozens of questions × 95% tests (A–Z) → guaranteed false positives. There’s no sign of correction (Benjamini–Hochberg/Bonferroni), so many flagged differences are noise. (Any banner page shows this testing regime; e.g., Q4–Q5 block, PDF p.101–103.) 2025-10-10 CBC Calgary Muni Pol…
Trust impact: Medium. Readers will over‑trust letter‑flags that should be treated as exploratory.
Specific examples that illustrate eroding trust
Education skew and its consequences: With HS‑or‑less only 6.7% of your achieved sample, attitudes that correlate with education (e.g., comfort with parties, institutional trust, left–right placement) will be systematically tilted. That imbalance is visible right in your Weighted Total line (Q1a table). (PDF p.7–8.) 2025-10-10 CBC Calgary Muni Pol…
Parties in municipal politics (Q6): Topline impression is “Calgarians broadly dislike parties,” but with 17% DK and the question presuming respondents understand recent legislation, this may be as much confusion as conviction: Negative 45 / Positive 13 / No difference 25 / DK 17. (PDF p.103–105.) 2025-10-10 CBC Calgary Muni Pol…
Left–right scale (Q10): You summarize ideological distribution (Left 0–4, Centre 5, Right 6–10), but the scale is unanchored to municipal issues and is asked after a long priorities battery; responses are context‑dependent. (PDF p.113–115.) 2025-10-10 CBC Calgary Muni Pol…
Resident vs voter confusion: Your vote‑intention banners include “Not eligible to vote” = 2%, confirming a mismatch between the sampling frame and the inferences readers will draw about the electorate. (PDF p.107–110.) 2025-10-10 CBC Calgary Muni Pol…
Why the score is this low
1) Sampling frame (4/10)
The study relies on a non‑probability online panel (“Trend Research Online Panel”), which brings unavoidable coverage and self‑selection bias. That can be fine if the rest of the design and reporting compensate for it, but here they don’t. The methodology states: 1,000 “residents of the City of Calgary” surveyed Oct 1–8, 2025, via Trend’s panel, directed by Janet Brown Opinion Research. It adds the common—but potentially misleading—“probability‑equivalent” MOE (+/‑3.1) even though a true MOE “does not apply.” A high‑standard pro would work much harder to bound, measure, or caveat non‑probability error. 2025-10-10 CBC Calgary Muni Pol…
2) Weighting and quotas (3/10)
Quotas were set only for age, gender, and quadrant, with “minimal weighting.” That leaves large room for imbalance on education, income, immigration status, tenure, language, or race/ethnicity—variables that often correlate with municipal preferences. The release itself shows a very highly educated sample (e.g., “Completed university” 37% and “Post‑grad” 19%; “HS or less” just 6–7%). With “minimal weighting,” this composition likely bakes attitudinal skew into estimates. A professional standard would weight on more dimensions or present sensitivity analyses.
3) Representativeness signals (4/10)
The income distribution is top‑heavy (e.g., “Over $120K” reported at ~31% of respondents) and again there’s no indication these imbalances were corrected or stress‑tested. At minimum, I’d expect demonstrations that key outcomes are stable across reasonable re‑weighting schemes. 2025-10-10 CBC Calgary Muni Pol…
4) Questionnaire design (6/10)
There’s helpful clarity in item wording, but the instrument leans heavily on 0–10 scales and then collapses them into arbitrary “NETS” (e.g., 7–10 vs. 0–3). That choice can change a headline materially, and a pro release would justify or triangulate those thresholds (e.g., show distributions, means, medians, and alternative cut lines). The left‑right self‑placement (0–10) is clear, but again reported with “NETS” and a mean; high‑standard practice would include distributional plots and robustness checks. 2025-10-10 CBC Calgary Muni Pol…
5) Statistical testing (4/10)
Tables flag “Significance Testing Applied: 95% (A–Z).” Applying conventional significance tests to a non‑probability sample without robust model‑based adjustments is, at best, an approximation. A top‑tier release would either suppress these flags or explain their limited interpretability here. 2025-10-10 CBC Calgary Muni Pol…
6) Coverage of alternatives & base definitions (5/10)
The mayoral “consideration” matrix and diagram are novel and readable, but the narrative says there are nine candidates while the visual and table emphasize five—which can shape readers’ sense of the viable field. It also conditions analyses on those “considering at least one candidate” (n=697), which excludes ~30% of the sample and can inflate impressions of engagement or polarization; a pro release would foreground the excluded base and show how conclusions change when everyone is included.
7) Fieldwork and QC (4/10)
We’re told the dates and vendor, but there’s no disclosure of quality controls (attention checks, straight‑line detection, device mix), completion time filters, or panel recruitment sources. Those details are standard at the “highest” professional bar. 2025-10-10 CBC Calgary Muni Pol…
8) Transparency (8/10)
Credit where it’s due: the front matter names sponsor, firm, panel, and dates; the crosstabs are extensive and label the banner plan clearly. This is better than many media releases.
9) Communication of uncertainty (6/10)
Graphics and tables are clear, but there are no uncertainty bands on figures and no scenario/sensitivity notes (e.g., how results move under alternate weighting). A pro release would visualize uncertainty and explicitly separate descriptive from inferential claims. The “consideration network” graphic, while clever, also lacks any uncertainty cues. 2025-10-10 CBC Calgary Muni Pol…
10) Reproducibility (4/10)
We get crosstabs but not the full weighting recipe and no microdata (even in anonymized form) for independent replication. For a media release this is common; for “industry professional—highest standard,” I’d expect at least a technical appendix with raking targets and weights. 2025-10-10 CBC Calgary Muni Pol…
Opinion | Calgarians are telling us what democracy should look like at City Hall. Will the campaigns listen?
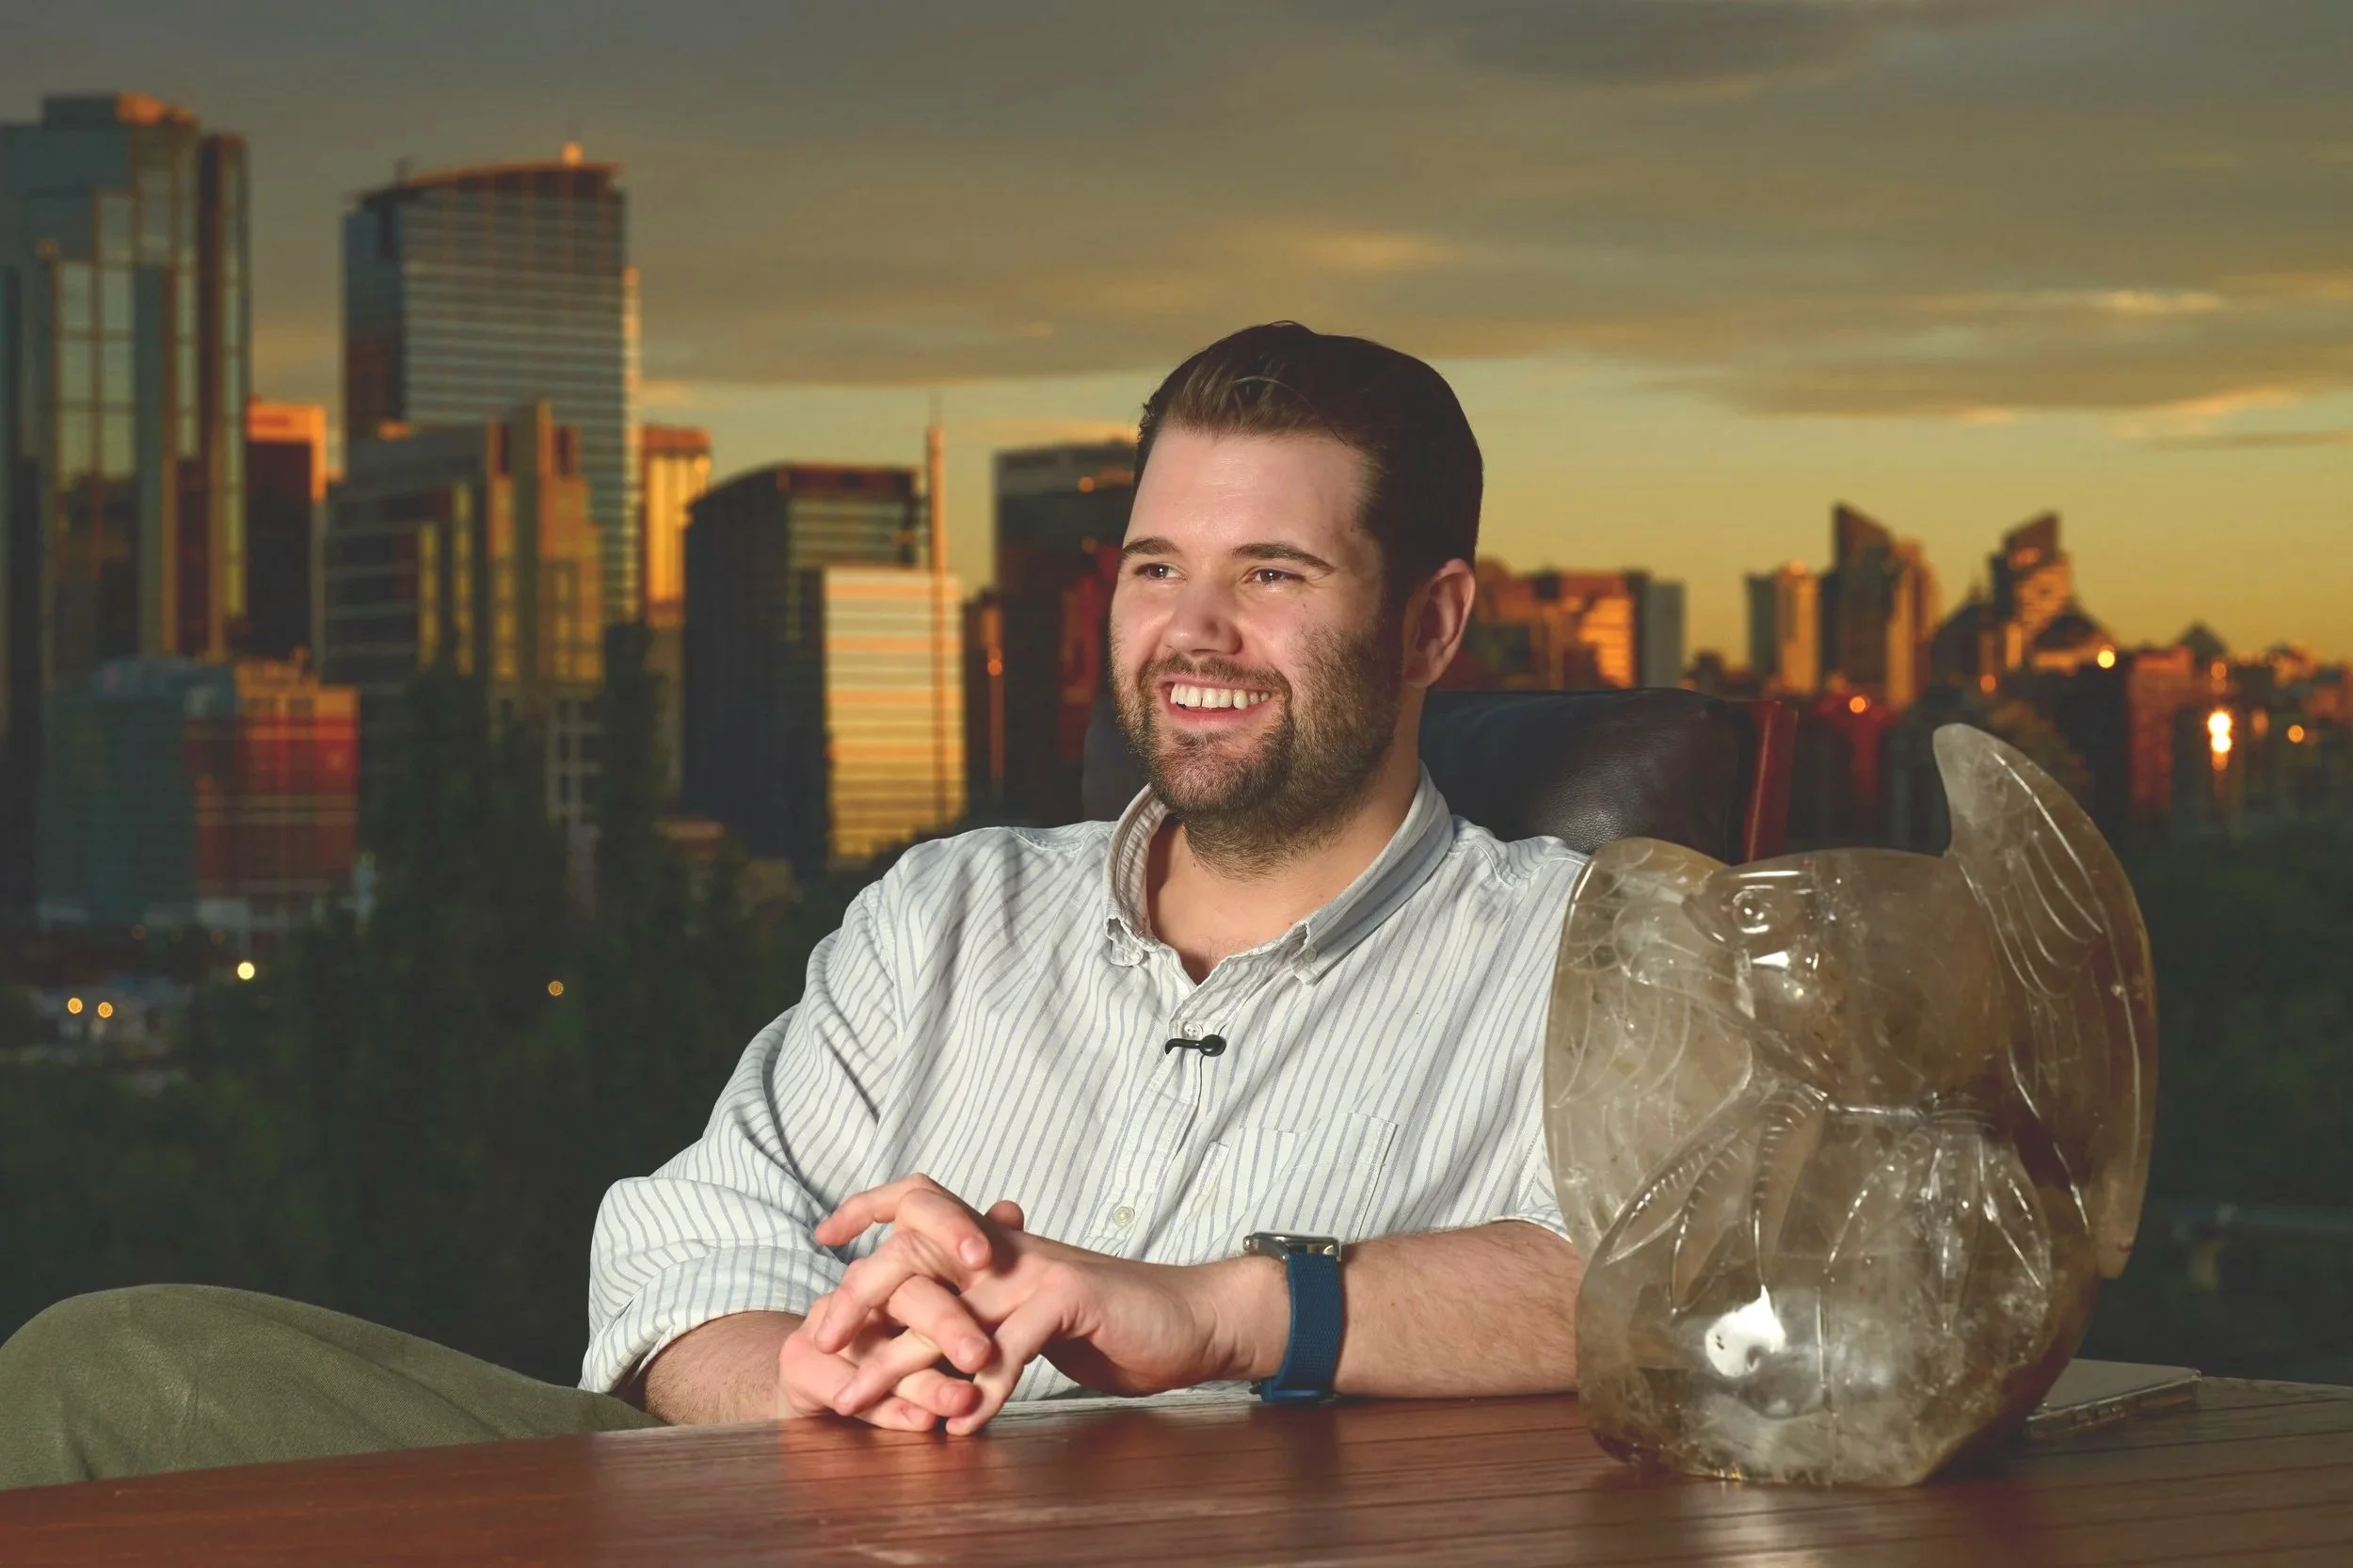
By Dr. Jaeger Gustafson

The clearest message in CBC Calgary’s new municipal poll isn’t about personalities. It’s about priorities—and what locals think democracy at City Hall should (and shouldn’t) be. Calgarians are strained by costs, leery of party brands in local races, and focused on practical basics: safety, roads, budgets and housing. That mood, not any one candidate, is setting the terms of this election. 2025-10-10 CBC Calgary Muni Pol…
Photo Source: MayorGus.ca

Logo Source: CBC Calgary
The clearest message in CBC Calgary’s new municipal poll isn’t about personalities. It’s about priorities—and what locals think democracy at City Hall should (and shouldn’t) be. Calgarians are strained by costs, leery of party brands in local races, and focused on practical basics: safety, roads, budgets and housing. That mood, not any one candidate, is setting the terms of this election. 2025-10-10 CBC Calgary Muni Pol…
The clearest message in CBC Calgary’s new municipal poll isn’t about personalities. It’s about priorities—and what locals think democracy at City Hall should (and shouldn’t) be. Calgarians are strained by costs, leery of party brands in local races, and focused on practical basics: safety, roads, budgets and housing. That mood, not any one candidate, is setting the terms of this election. 2025-10-10 CBC Calgary Muni Pol…

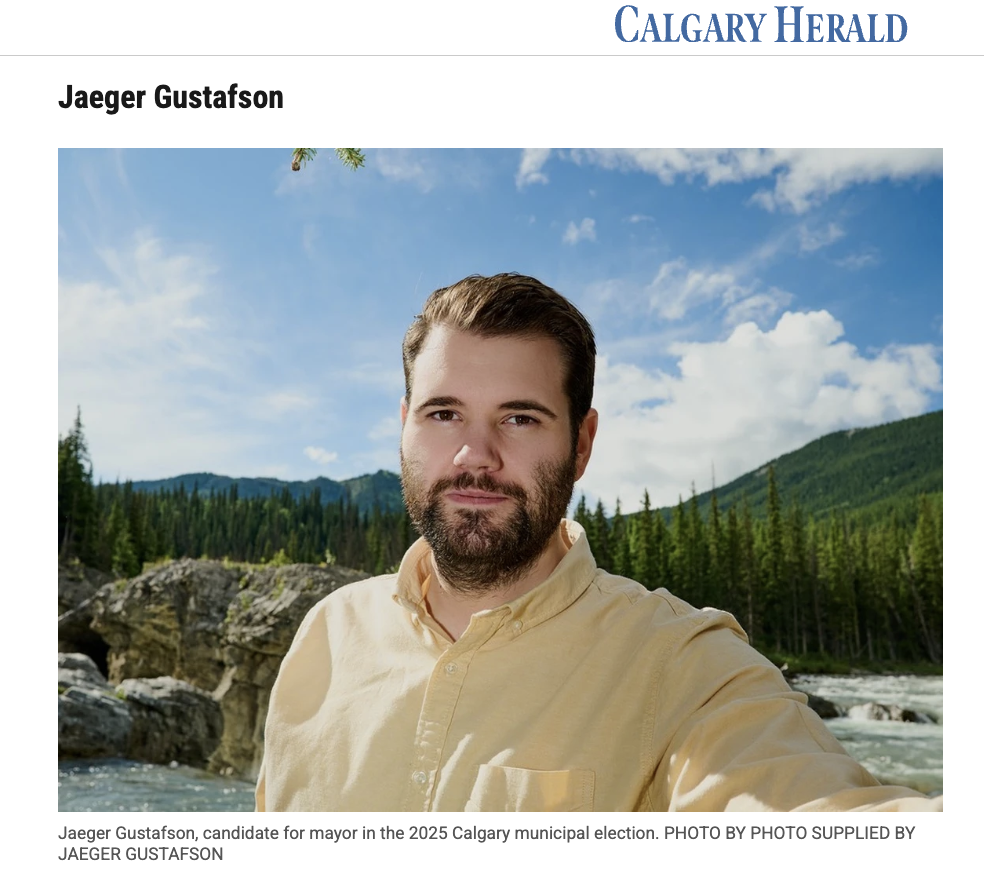
Dr. Jaeger Gustafson, VISIOIN: MAYOR GUSTAFSON, Calgary, Alta. 2025
Start with the household ledger. Six in ten Calgarians say it’s been difficult to meet monthly expenses in recent months—an unmistakable backdrop for every promise made on the trail. Only 37 per cent say it’s been easy. 2025-10-10 CBC Calgary Muni Pol… The same tightening is visible in how people view growth. A solid 64 per cent say Calgary’s population is growing too fast, and a majority (51 per cent) say recent growth has had a negative personal impact. That combination—faster growth, felt as friction—helps explain why voters are primed for arguments about planning, infrastructure and affordability.
Ask what City Hall should do next and the answers are pragmatic. Controlling spending and the city budget is rated a high‑priority (7–10 on a 10‑point scale) by 77 per cent. Making housing more affordable is high‑priority for 70 per cent. Improving public safety and reducing crime is higher still, at 81 per cent, while maintaining Calgary’s existing road system tops the list at 86 per cent. Concerns about downtown disorder (75 per cent high priority) also rank near the top, and even snow clearing—rarely a ballot‑box slogan—draws a majority saying it deserves heightened attention (59 per cent high priority). This is bread‑and‑butter governance, not culture war.
If there’s a constitutional question in this municipal contest, it’s about partisanship. On balance, Calgarians don’t think parties have helped local politics: 45 per cent say the introduction of municipal parties has been negative; only 13 per cent call it positive. Asked how party labels would affect their vote, 40 per cent say they’d be less likely to support a party‑affiliated candidate; just 16 per cent say more likely. For many voters, democracy at the city level still means independent, ward‑focused problem‑solving, not party whips and caucus lines.
That localist instinct sits alongside a right‑tilting electorate—44 per cent place themselves on the right (6–10), 35 per cent on the left (0–4), and only 15 per cent in the centre. Yet ideological identity doesn’t fully predict priorities: majorities across the spectrum elevate fiscal control, safety and housing. Calgarians are signalling a mandate to fix stuff more than to wave flags.
The mood isn’t fatalistic. A majority (53 per cent) disagree that “Calgary’s best days are behind it,” compared with 38 per cent who agree. That’s not rose‑coloured optimism; it’s a bet that, with coherent policy and competent execution, the city’s next chapter can be better than the last few bruising years. For candidates, that’s an invitation to replace grievance with governing plans. 2025-10-10 CBC Calgary Muni Pol…
What this means for the campaign
Lead with affordability and competence. Voters are living the math. Proposals that credibly reduce costs (or improve value for taxes) will find a hearing, as will detailed plans on safety, housing supply and core services.
Talk policy, not party. With a plurality wary of party slates at City Hall, campaign messages tied too tightly to partisan identity risk underperforming—particularly with voters who say party labels make them less likely to support a candidate. 2025-10-10 CBC Calgary Muni Pol…
Acknowledge growth pressures. Calgarians aren’t anti‑growth; they’re saying the pace feels mismanaged. The winning frame is how to absorb people and investment without eroding the quality of daily life.
What this poll can’t tell us (and what responsible reporting should)
This is a non‑probability online panel of 1,000 Calgary residents (Trend Research), conducted Oct. 1–8 under the direction of Janet Brown Opinion Research. A traditional “margin of error” does not apply to non‑probability samples, though the report notes that a comparable probability sample of 1,000 would carry a ±3.1‑point margin, 19 times out of 20. That means small differences—especially between candidates in the low‑ to mid‑20s—should be treated with caution, and trends should be verified with multiple measurements. Horse‑race numbers reflect decided and leaning voters (657 of 1,000), which can amplify apparent leads when a large undecided remains. Readers deserve these caveats with every chart.
A democratic throughline
Strip away the noise and Calgarians are articulating a democratic ethic: keep municipal politics close to the ground; focus on service delivery; spend carefully; make room for new neighbours without breaking what works. That’s not cynicism—it’s a citizen’s brief. Campaigns that respect it will sound different in the coming weeks: fewer slogans, more line‑by‑line budgets; fewer tribal cues, more measurable targets for safety, housing and core infrastructure.
In other words, the value of democracy here is not abstract. It’s the power to hire (or fire) the people who plow the snow, balance the books and make the city livable. Now it’s on every candidate to meet voters where they are.
About the poll
CBC Calgary Municipal Election Poll. Fielded Oct. 1–8, 2025, with 1,000 City of Calgary residents via Trend Research Online Panel, under the direction of Janet Brown Opinion Research. Quotas by age, gender and city quadrant; minimal weighting to Statistics Canada benchmarks. Non‑probability survey (no applicable margin of error). The report provides an illustrative ±3.1 points for a comparable probability sample.
Key findings cited
Meeting monthly expenses difficult (NET 62%); pace of population growth “too fast” (64%); recent growth negative personally (51%); priorities: control spending (7–10: 77%), housing affordability (70%), public safety (81%), maintain roads (86%), address downtown disorder (75%), snow clearing (59%); municipal parties seen as negative (45%) and a vote deterrent.
This column is an opinion by Dr. Jaeger Gustafson The analysis is based on the poll cited above and is governed by standards for accuracy, fairness and transparency.
Advertising: MayorGus.ca/horses

Read More: